


Dr Simon Parry, a hydrologist at the UK Centre for Ecology & Hydrology (UKCEH), explains how the current drought compares with past events and how it may evolve in the near future
UKCEH had previously highlighted the precarious hydrological situation following a very dry spring and early summer. Low groundwater levels, reservoir stocks and especially river flows were already prompting concerns around the water resources situation. Fast forward a few weeks, and drought is now officially upon us.
One of the questions that are commonly asked is how the current event compares with the 1976 drought, which still stands as the benchmark episode in the UK. Dry conditions through the winter, spring and summer of 1975-76 resulted in widespread water shortages and drought impacts on a scale not since repeated over the last half century. As drought has developed through 2022 there have been similarities with historical dry spells, but low river flows have generally not rivaled those of 1976. In the face of continued settled and dry weather, that might be about to change.
How did we arrive here?
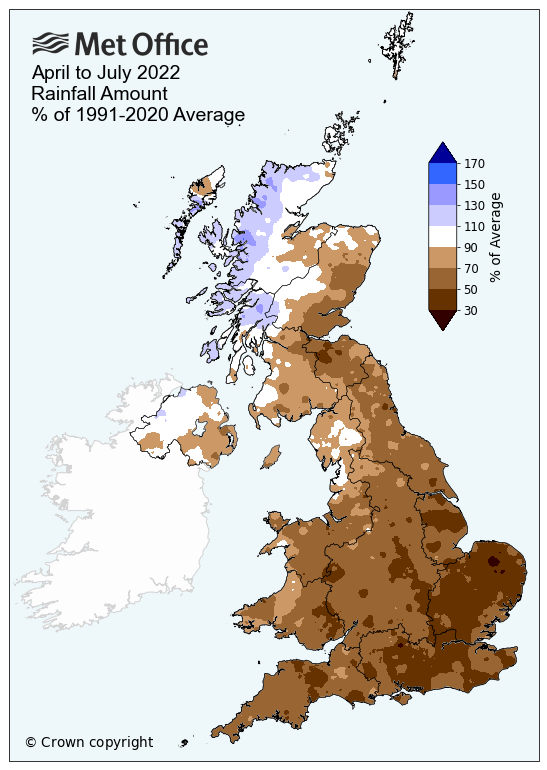
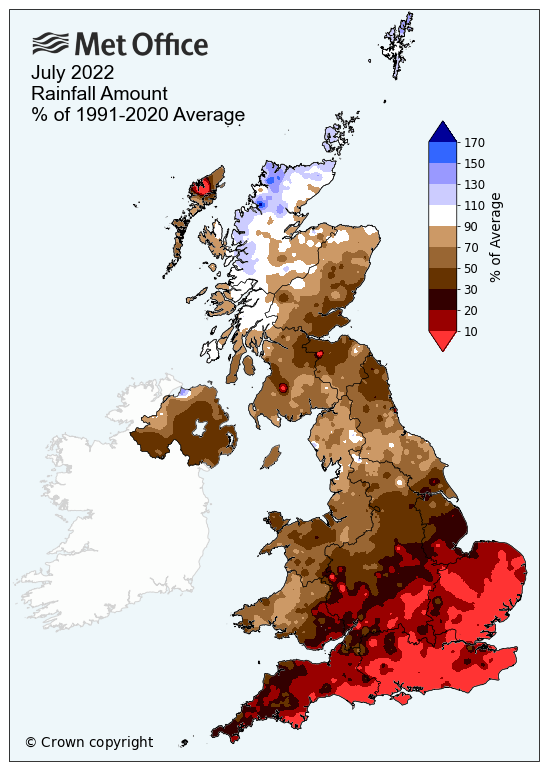
July continued the dry trend that has been entrenched throughout 2022. Thames, Southern and Anglian regions all recorded their driest July in records from 1836. More of the same has followed this month: across southeast England, no rainfall was recorded in the first two weeks of August, though some heavier downpours have occurred since. The summer has punctuated rainfall shortages in England that span both the calendar year 2022 (the driest January-July since 1976) and back into the previous autumn (the driest November-July since 1976 for the Southeast).
At the end of July, soils were notably to exceptionally dry across central, southern and eastern England. At some sites, soil moisture that had been within the normal range in early July fell dramatically to exceptionally low levels by the end of the month. For many of the COSMOS-UK soil moisture monitoring sites in the Southeast, late July soil moisture was the lowest for any month since records began in 2013.
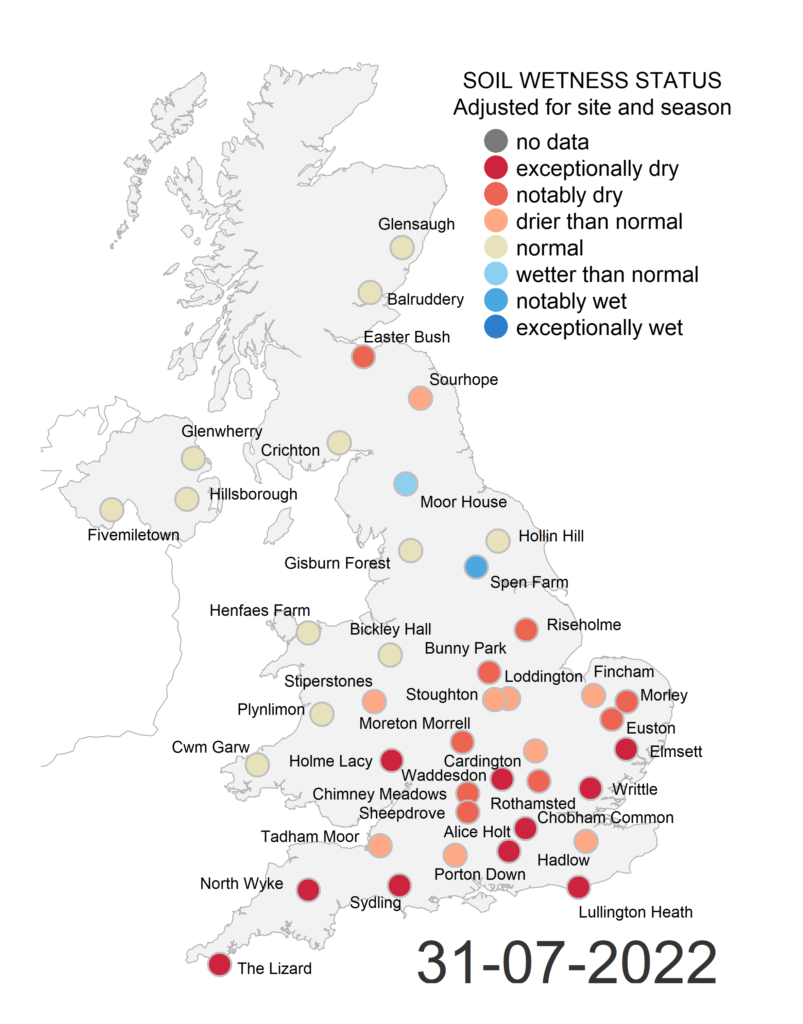
Famous for its green countryside, southern and eastern Britain has turned into a parched, arid landscape. The dry, hot conditions have led to soils becoming hard and impermeable, enhancing the risk of localized flash flooding. Exceptionally low soil moisture coupled with high temperatures has made the UK highly susceptible to wildfires, with three times the number compared with normal. The lack of moisture in soils has had significant agricultural impacts, including hindering both the harvesting and planting of crops. Vegetation for livestock grazing is also in short supply, increasing reliance on feed set aside for the winter.
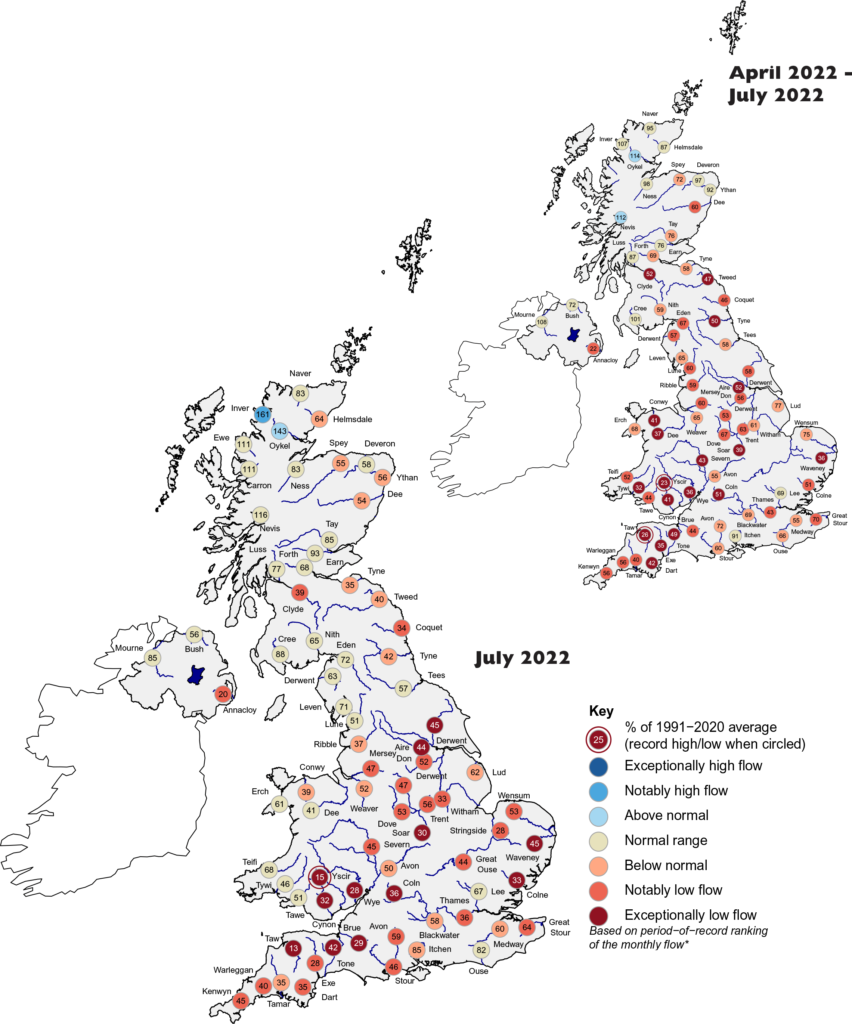
River flows for July were notably or exceptionally low across central, southern and eastern England, less than half of the average or lower, and as little as 13% of the July average on the Taw (Devon). In South Wales, the Yscir recorded its lowest July average flow in a record from 1972, and flows were the third lowest for July on the Wye in a long record from 1936. Between April and July, exceptionally low flows were recorded across the majority of the UK.
With the exception of some short-lived increases in flows in response to localized intense rainfall, flows in catchments away from western Scotland and northwest England have generally continued to decline throughout August. Common impacts of drought on water quality and ecology are likely happening already, and there is evidence of algal blooms and fish rescues.
Groundwater levels were below normal or lower at the end of July across large parts of southern and eastern England. Levels were exceptionally low in the carboniferous limestone of South Wales and the chalk of southern England. The status of groundwater – low but generally not exceptional – contrasts with river flows. The (relatively) healthier state of groundwater across parts of the chalk reflects a pulse of recharge in the late autumn/early winter of 2021, meaning levels were in the normal range at the start of 2022.
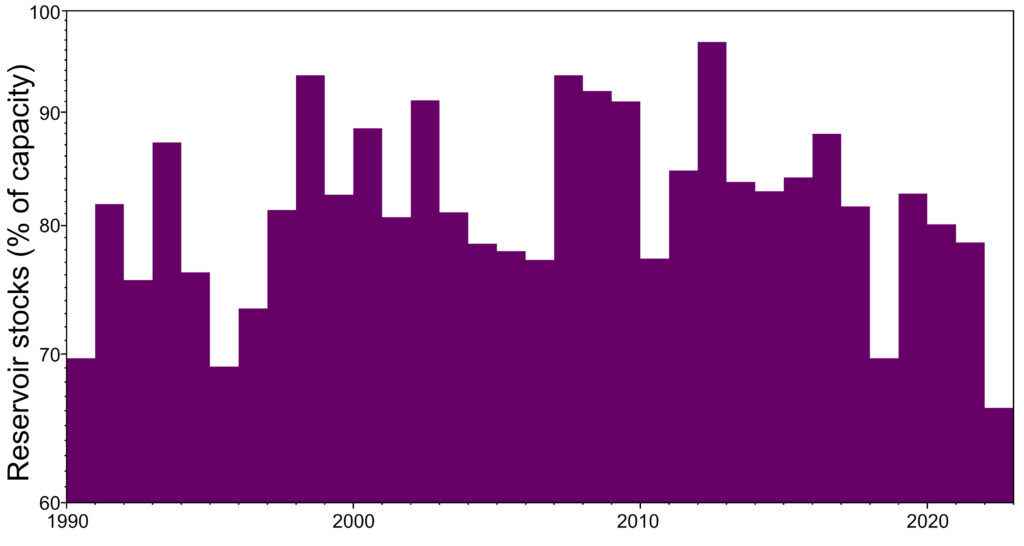
Reservoir stocks have declined substantially over recent months in the face of particularly high demand during a hot summer with two exceptional heat waves. Late July stocks for England and Wales were the lowest on record in a series from 1990, and many reservoirs were more than 25% below their average for the time of year. Colliford (Cornwall) was 34% below average and the shortfalls in stored water are clearly evident in reservoirs around the UK. These shortfalls have resulted in temporary use bans (or ‘hosepipe’ bans) in some areas, while other companies such as Anglian Water have suggested restrictions in 2022 are unlikely to be necessary.
How does the 2022 drought compare with previous major drought events?
It can be difficult to compare droughts because there are many relevant characteristics, such as intensity, duration and spatial extent. We have undertaken several studies looking at past UK droughts in terms of meteorology and river flows, and although there are differences in their relative importance, these studies typically identify the same historical drought episodes – with 1976 being the most famous event, which is still regarded as a benchmark across large parts of the country.
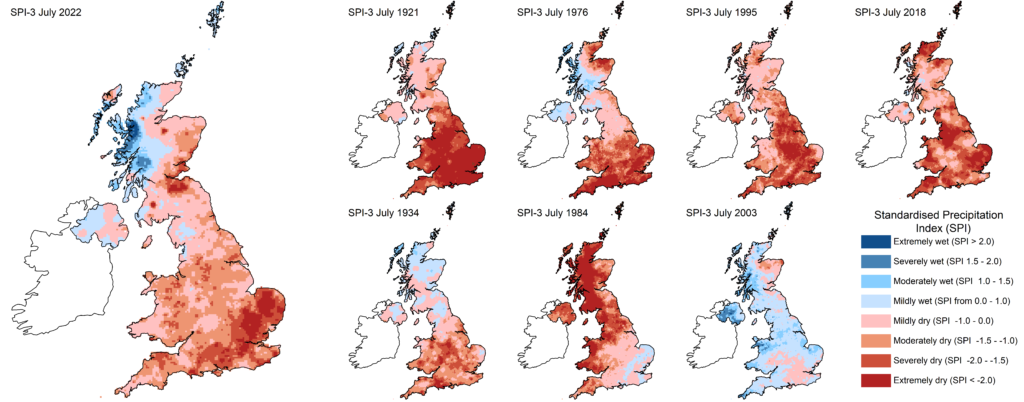
For meteorological drought, it is common to compare rainfall deficits using the Standardized Precipitation Index (SPI), a widely used drought indicator. In the maps below, we compare rainfall deficits over the three-month periods ending in July (SPI-3) for some well-known historical episodes from the last 100 years. Although the 2022 deficits are very widespread, they are less spatially extensive than in some events (e.g. the most recent major drought in 2018, or in 1995), and the focus of severe deficits is more restricted to southeast England. Clearly, 1976 saw more severe deficits for the May-July period but both events are eclipsed by the exceptional aridity of the drought of a century ago, in 1921. Other events are also more regional – for example, the 1984 drought was focused on spring-summer in the Northwest.
Of course, these maps are just for the May-July period, and different outcomes would be seen for different durations. For example, the high summer of 2003 was relatively damp, but deficits were notable over longer periods. As noted above, the 1975-76 drought was more severe than the current drought when looking at longer periods back to the autumn/winter. Also, it is worth noting that these comparisons are only made for the period up to the end of July, for when rainfall data are currently available – we will revisit these comparisons in September when data for August is available.
For river flows, historical comparisons for individual catchments are challenging because national-scale droughts such as those shown in the maps above may not be as severe either regionally or in specific catchments.
Here we compare river flows in 2022 with those from the 2018 drought and the benchmark 1976 drought. The river flow data for 2022 comprises data to late July from the Hydrological Summary supplemented with near-real-time river flow data to late August from the UK Water Resources Portal.
The persistently low river flows through the spring and summer of 2022 are shown below for two catchments (the Clyde in central Scotland and the Great Stour in Kent) that are broadly representative of the situation in many UK catchments.
River flows have generally tracked in between 2018 and 1976 for most of the year. For much of the spring and summer, flows in 2022 in catchments across England and Wales have remained marginally higher than those in 1976. (Over this period for the Clyde, river flows were actually lower in 2022 than in 1976, but this part of western Scotland was the wetter exception to drought conditions in 1976.) However, the margin has begun to shrink in recent months and 2022 flows are now close to matching or eclipsing those of 1976. The red lines in the graphs below show 1976 flows and represent the lowest flows ever recorded for many catchments in the UK, so there is clear potential for new record low flows to be established should the current situation continue.
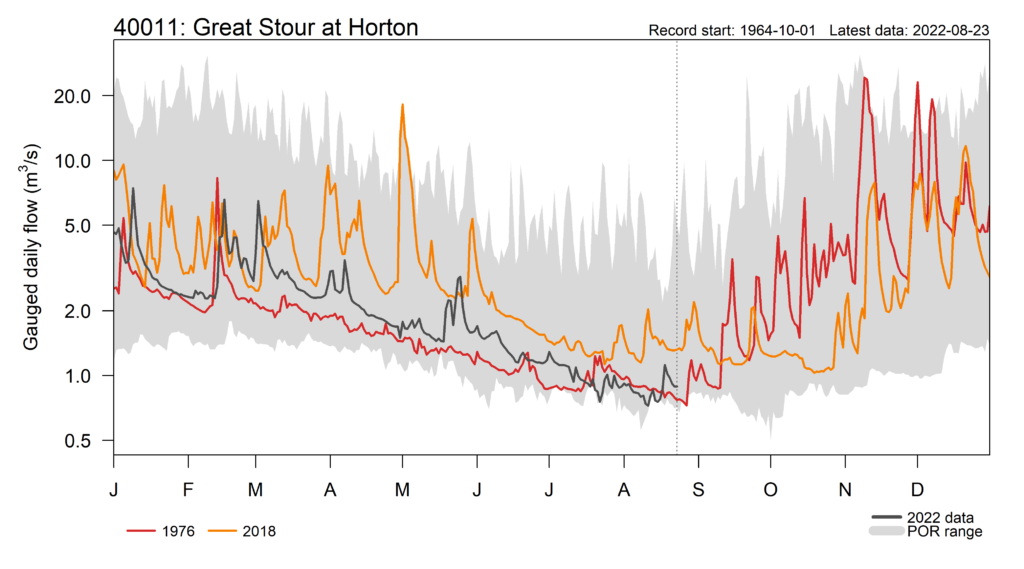
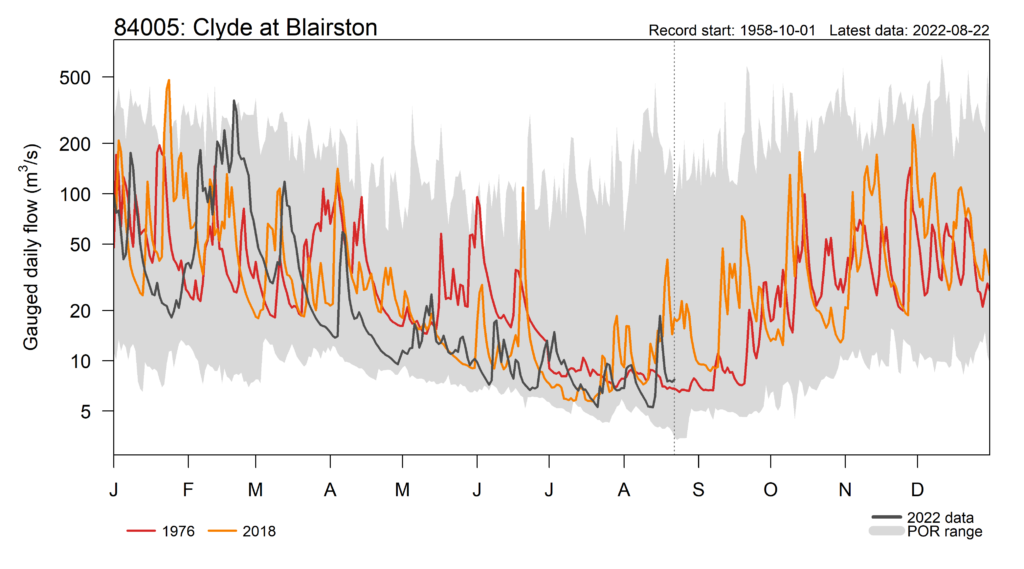
In 1976 (and to a lesser extent 2018), river flows in the autumn increased sharply in response to some very wet weather, as signified by the steepness of the red (1976) and orange (2018) lines in the figures above. In the absence of sustained wet weather in the next few weeks, it’s possible that 2022 will challenge 1976 as the benchmark for low flows in drought-affected areas of the UK.
One important point to note is that water supply systems are much more resilient to drought than in 1976. This means that even if low river flows drop to new record lows, there is unlikely to be the same level of water use restrictions seen in that event – although of course, current restrictions will still have an impact on many water consumers and there is considerable potential for wider ecological impacts.
What are the prospects for the current situation continuing?
Despite the recent showery and occasionally very wet weather, in short- to medium-term outlooks there is little suggestion that the prolonged wet weather needed to reverse the current situation is imminent. The Hydrological Outlook for August-October found that exceptionally high rainfall is required to return to normal conditions in the short term – for southern and eastern England, the rainfall required to return to normal through August and September is associated with a 10-25-year return period.
Recent research on the recovery from drought conditions in the UK found that the abrupt recovery in 1976 is among only a very few examples in long river flow records, and that single-season recoveries from drought are rare and generally associated with exceptional rainfall. With every passing day of limited rainfall, in southern England especially, it becomes increasingly likely that record-setting low flows beyond those of the 1976 drought will occur in September.
A new Hydrological Outlook is due to be published in early September, using the latest forecasts to predict the likely outlook for river flows and groundwater levels for the crucial autumn recharge season. The timing and amount of rainfall we receive over this period will determine when rewetting of soils and replenishment of reservoir stocks and groundwater storage in aquifers can begin. This, in turn, determines the extent to which water resources are bolstered and therefore dictates the outlook for whether drought will persist into 2023.
In the meantime, you can access the latest information on the drought as it evolves through the UK Water Resources Portal, updated daily with near-real-time data on soil moisture and river flows (in England and Scotland), alongside monthly rainfall and groundwater level data.