The National Institute of Water and Atmospheric Research (NIWA) publishes monthly climate summaries which report on the occurrence of top four extreme climate and weather events in New Zealand.
These summaries provide context to present-day observations with respect to the historical record at stations located throughout the country. In the last decade, NIWA has reported many record-setting high temperature extremes in the climate summaries, with comparatively few record-setting low temperature extremes. As part of this study, ranked temperature and rainfall data was generated iteratively from 1951 to 2020 and assessed if the trend of occurrences of these extremes (high and low) in New Zealand is changing.
This study sought to examine i) how do the frequencies of monthly climate extremes differ from those of a stationary climate for a static set of station groupings, and ii) are the trends in temperature extremes consistent with New Zealand’s observed warming?
By quantifying the changing frequency of record or near-record climate observations in the context of climate summaries in New Zealand, it could be determined if the trends are significant and also whether discrepancies between high and low occurrences are apparent.
Extremeness Ratio (R)
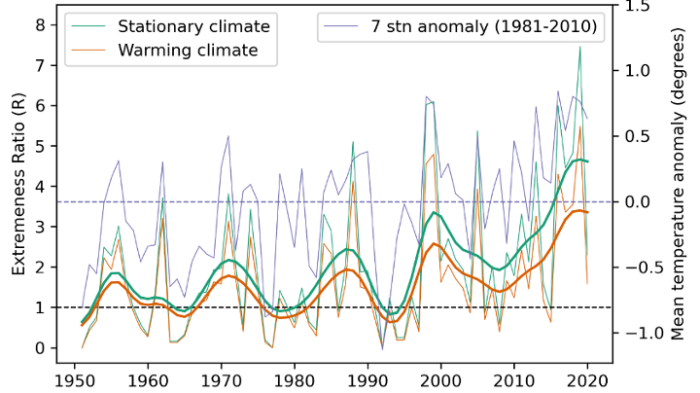
Extremes are ranked based on the historical record, and any value that exceeds a previous historical threshold becomes a new extreme. This means that the threshold for a new extreme changes over time. As a result, an extreme that occurs later in a timeseries carries more weight, i.e. is more unusual, than an extreme that occurred prior. To address this problem, extremeness ratio (R) was derived by normalizing the observed extremes with an expected probability of an extreme based on no long-term warming. In addition, the trend of mean temperature extremes was assessed by also taking the climate warming trend (~1°C per century) into account on a homogenized stations data set.
Temperature related results:
In the last decade, on average, high monthly mean temperature extremes in New Zealand are occurring 4-5 times more often than expected in a climate with no long-term warming. New Zealand’s homogenized seven-station temperature series was also examined and a similar trend for mean temperature extremes was found. In addition, the mean temperature extremes was calculated by taking the climate warming trend (~1°C per century) into account and the results showed that the rate of increase in extremes is faster than the rate of increase in mean temperature.
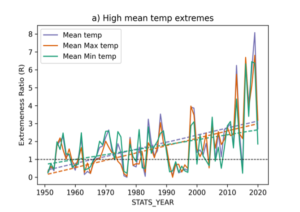
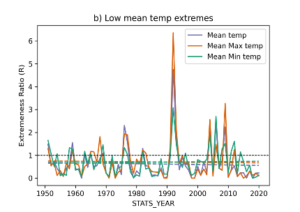
Results for all temperature extremes: a) high temperature extremes (left), b) low temperature extremes (right). Dotted lines in all panels are the fitted linear trend line corresponding to each variable.
Rainfall related:
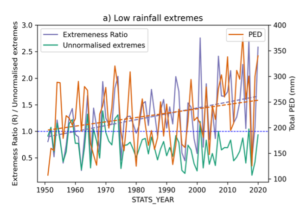
A positive trend was found in both high and low rainfall extremes with the low rainfall trend most prominent in eastern New Zealand. This also correlated with Potential Evapotranspiration Deficit (PED).
 .
. 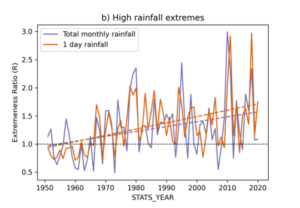
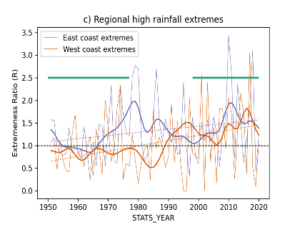
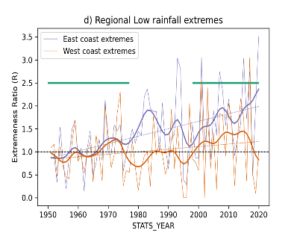
Results for rainfall extremes: a) Low rain trend compared with extremes without normalization and PED. Note: A scaling factor of 10 was applied to the unnormalized extremes so they could be included with the extremeness ratio on a single axis. b) High rain extremes (1-day rain and total monthly rain). c & d) Occurrence of high and low rainfall extremes respectively, partitioned by east and west coast region. IPO negative phase (green bars) and the disagreement between west and east coast high/low extremes in 1970s and 1980s might be related to the changing phase of IPO.
Reference paper: Trend analysis on frequency of New Zealand climate extremes, published in Weather and climate, Journal of the Meteorological Society of New Zealand, Vol 41 (2021).


