On three consecutive days in late April 2011, a series of deadly tornadoes ripped across the USA. Known as the Super Outbreak, the weather event involved 360 tornadoes across 21 states and led to the loss of nearly 350 lives. It was the largest, costliest tornado outbreak – and one of the deadliest – ever recorded in the US. Many of those killed came from “vulnerable and under-served communities”, according to Dave Bieger, chief of the decision support integration branch of the US National Weather Service (NWS).
Bieger says that the Super Outbreak “underscored the need to support public safety officials in better understanding weather impacts so they can make informed and effective decisions”. He notes that the disaster was pivotal in shifting the NWS toward embracing a new form of weather forecasting that emphasizes the likely impacts of a weather event.
Known to many as impact-based forecasting (though Bieger prefers the term ‘impact-based services’), this new form of forecasting is based on extensive social sciences research showing that people are more likely to take action if they understand the potential impact of an event. “The whole point of doing impact-based warnings is to provide actionable advice that people can make some use of,” says Chris Walsh, head of warnings and guidance at the UK Met Office. “If you tell someone there are going to be 50mph [80km/h] winds, it could mean nothing to them. The way we try to do our warnings is to make the weather a bit more real for people.”
For its impact-based warnings the Met Office uses a color scale system in which yellow, amber and red denote progressively bigger potential impacts. Beyond the color codes, each impact level also includes specific details on the potential risks of different weather events. Among the risks associated with a medium-level impact for rain, for example, are injuries with danger to life, disruption to day-to-day routines and activities, and transportation routes and travel services affected.
Weather tags at NWS
Although NWS also uses color scales to depict weather risks and impacts, “There is no singular scale for all weather hazards,” according to Bieger. He explains that NWS is working with experts in societal, behavioral and economic sciences to develop “more clear and cohesive messaging of risks and impacts across a continuum of impact-based messaging”.
Currently, NWS communicates risks via a product called the Impact-Based Warning. The warning takes the form of so-called ‘event tags’, which appear at the bottom of severe weather warnings issued by the weather service. In the case of a tornado warning, for example, the event tag will include tornado threat information such as the threat posed to life, business and property.
Bieger notes that research from the WMO suggests that, “There may not be a one-size-fits- all way to conduct impact-based messaging. The point of this transition is to find ways to best meet the needs of specific populations, so different kinds of messaging systems may naturally result.”
What influences a weather impact
There are many challenges to conveying the impact of a weather event, not least of which is the fact that weather is by no means the only variable influencing how a weather event affects a community. For example, the same volume of rainfall can have very different consequences depending on the conditions on the ground, notes Walsh.
“If you have 30mm in a couple of hours, and it’s on completely dry ground at the start of the season, it might have no impact whatsoever,” he says. “But if it’s on saturated ground where you’ve had a winter’s worth of rain, that may generate a warning.”
Another big influence on impacts are the demographics and the socioeconomics of the affected communities. To give a simple example, the elderly are usually much more at risk from extreme weather than young people. Also, notes Walsh, young people – specifically young men between the ages of 18 and 30 – are statistically “the most likely to not take any action off the back of a warning”.
This brings us to another problem with impact-based warnings, which is the perception of risk and how it varies among different groups. “The perception of risks for a given weather event varies among the public based on a variety of external individual and socioeconomic factors including age, gender, education level, past experience and much more,” says Bieger. “Some events are more difficult to visually experience, such as excessive heat or cold, which in turn makes demonstrating impact challenging.
“Moreover, some threats are discounted because they seem more controllable and less scary, even if they cause the most fatalities. Impact-based messaging is essential to bridge these gaps in risk perception and inform decisions,” he comments.

“If you have 30mm in a couple of hours, and it’s on completely dry ground at the start of the season, it might have no impact whatsoever”
Chris Walsh, UK Met Office
The private sector
The public are not the only ones who can benefit from impact-based forecasting. Weather services aimed at the private sector also use it. Weatherzone is an Australian meteorological company that provides weather data to private industries including energy, utilities and mining.
Impact-based communication needs to take account of how the same weather event can affect industries differently, according to Ben Domensino, a member of Weatherzone’s weather risk communications team. Domensino offers the example of a “southerly buster” – a weather event common to the eastern New South Wales region of Australia during the warmer months.
“These abrupt southerly wind changes cause a rapid increase in wind speed and wave heights near the coast and an abrupt drop in temperatures,” he explains, noting that these climatic changes can affect industries such as energy and marine transportation in quite different ways.

“A southerly buster can cause energy demand to suddenly decrease as temperatures drop with the change [and use their air-conditioners less], which can affect the market price of energy,” he continues. “However, the rapid onset of powerful winds and larger waves during a southerly buster can also make port operations dangerous, sometimes requiring operators to secure vessels before the change arrives.
“Another example is fog, which can reduce visibility enough to cause safety concerns for operations at mines and airports. While visibility is not a big concern for the energy market, fog lingering late into the day can limit the amount of heating near the surface, which can affect the day’s maximum temperature and therefore influence how much people need to use their air-conditioners,” he adds.
Understanding in advance the weather vulnerabilities of different industries is an important part of effectively communicating impacts. Domensino says, “The main type of weather that impacts energy clients is temperature, as this is the primary driver of day-to-day energy demand. Utility operators are more concerned about weather that can impact infrastructure, such as damaging winds, thunderstorms and fire. Mining operations can be affected by weather that impacts safety, such as fog, lightning and heavy rain.”
A team effort
Understanding impacts on the broader public is a more complex task and requires several stakeholders, according to Walsh: “It’s a team effort rather than just one individual looking at a weather threshold and then trying to decide whether there’s an impact or not.”
At the UK Met Office, a team of senior meteorologists is tasked with issuing impact-based warnings but it doesn’t work in isolation. Several other groups within the agency feed the team with data that informs its decision making. One of the most important of these groups, notes Walsh, is the team of civil contingencies advisors.
“That’s a group of people geographically dispersed around the country that link in with all the local resilience forums,” he explains. “So, they’ll be the ones speaking to the police, the fire service and the local councils.”
After a major weather event, the Met Office, via its civil contingencies team, conducts workshops regionally to understand what the local impacts were. Through this process it can build up a geographical and historical understanding of real-world impacts so that when a similar weather event is predicted, it can more accurately forecast what the effects will be.

“Mining operations can be affected by weather that impacts safety, such as fog, lightning and heavy rain”Ben Domensino, Weatherzone
In an era of climate change, in which extreme weather is becoming more prevalent, the switch to impact-based forecasting is of growing importance. Unfortunately, the impacts of many of the weather events that climate change is making more likely, such as thunderstorms, are also the hardest to predict.
“Thunderstorms are notoriously difficult to predict because they are an extremely localized and high-impact mode of weather,” says Domensino. “Modern-day forecast models help meteorologists predict how likely it is for thunderstorms to develop in a general region at any given time of day. However, until the thunderstorm cells form, it is very difficult to know exactly where lightning will strike and which locations will get the most rain or the strongest winds from the storm.”
The UK is bracing itself for an uptick in what Walsh terms “high-impact, low-likelihood” events in the coming years. As a result, a current big area of focus for the Met Office is how to provide people with actionable information at very short notice. “A thunderstorm can be very short notice but very high impact,” says Walsh. “So what we’re starting to look at is, if we give you 30 minutes’ notice, what will you be able to do in that time that is useful to you, and what’s the kind of critical lead time that you need to be able to take some positive action? And that’s a question we’re diving into a lot more deeply now.”
In the news
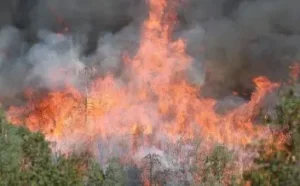
UNIVERSITY OF OKLAHOMA RECEIVES US$1.4M GRANT FOR IMPACT-BASED WILDFIRE RESEARCH
In February of this year, the Cooperative Institute for Severe and High-Impact Weather Research and Operations (CIWRO) at the University of Oklahoma received US$1.4m to conduct research into mitigating the impacts of wildfires across the country.

CIWRO will use the grant to conduct two major studies: probabilistic fire weather guidance and fire weather observation analysis. Using 15 years of wildfire data, the probabilistic fire weather guidance project will identify a statistical relationship between the critical level of fire weather outlooks that are issued by the National Weather Service Storm Prediction Center (SPC) and fire spread rate, as well as the cost of fire suppression.
“The resultant technology of this project will provide real-time guidance on anticipated cost and magnitude of fire suppression resources for a wildfire scenario as statistically related to the probabilistic critical level forecast of SPC fire weather outlooks,” says David Jahn, a research scientist at CIWRO and principal investigator on the project. “Such technology will be of real value to fire and emergency managers to anticipate the amount and cost of resources to address a specific wildfire event.”
The fire weather observation analysis project aims to increase understanding and improve predictions of the structure, behavior and downstream impacts of both plume- and wind-driven wildfires in the USA, better characterize land surface conditions post-wildfire and enhance understanding of hydrological response to flash floods/debris flows post-wildfire.
Using deployable radar and uncrewed aerial systems, scientists will collect unique observations of active wildfires and post-wildfire environments. This data will be used for detailed case analyses of wildfireand post-wildfire-related events. It will also be used for the validation and development of the warn-on-forecast system for smoke, to improve short-term forecasts of up to three hours in high-impact fire weather events. Improved fire weather impact observations and forecasts are expected to aid decision making when determining where life and property impacts will be greatest and enable better mitigation efforts.
Read more at: Read more at: www.meteorologicaltechnologyinternational.com
TRACKING THE IMPACT OF WEATHER ON MIGRAINES

One of the most interesting, though least understood, impacts of weather is how it affects pain-related health conditions such as migraines and arthritis. Although several studies have found a correlation between weather and pain-related conditions, the exact nature of that correlation has often proved hard to pin down, notes Chris Elcik, a researcher on the subject at the University of Georgia.
“There are a lot of studies out there that focus on weather variables such as pressure, temperature, moisture, but it’s really inconclusive,” says Elcik. “Some studies find that higher temperature leads to pain, other studies that low temperature leads to pain; it’s all over the place.”
Determined to find his own answers, Elcik, who is taking up a position as an assistant professor of meteorology at Salisbury University in Maryland later this year, ran his own study looking at the correlation between weather and a host of pain-related conditions including fibromyalgia, rheumatoid arthritis, osteoarthritis, migraines and general back pain.
For his study, he decided to take the focus away from individual variables like temperature or pressure because, as he notes, “If I go outside on a given day, I don’t just experience temperature or just pressure. I get all these variables impacting me at once, synergistically.”
With this in mind, Elcik chose to focus more on weather features, such as “weather events, weather types and air masses”. Other recent studies have followed the same approach, with much more consistent results than the studies that focused on weather variables, he notes. According to these studies the most common weather feature that seems to result in higher incidences of pain-related conditions is moist tropical air mass. Elcik is hopeful that his research will help inform the accuracy of future pain-related weather forecasts. While such forecasts do already exist – the US weather service AccuWeather, for example, provides daily arthritis and migraine forecasts – Elcik says that not enough research has been done yet to consistently establish the exact nature of the correlation between pain and weather.
“Currently, with so many studies saying it’s due to high or low temperature, pressure increases or decreases, or that pressure has nothing to do with it, with that level of inconsistency, it’s just so hard to pinpoint a forecast,” he concludes.
This article originally appeared in the April 2024 issue of Meteorological Technology International. To view the magazine in full, click here.


