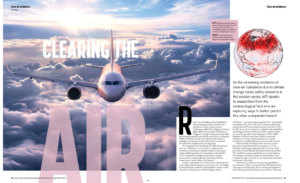
As the increasing incidence of clear-air turbulence due to climate change raises safety concerns in the aviation sector, MTI speaks to researchers from the meteorological field who are exploring ways to better predict this often unexpected hazard.
Recent news headlines have highlighted the increasing incidence of severe air turbulence in the aviation sector. Turbulence suffered by Singapore Airlines flight SQ321 from London Heathrow to Singapore Changi in May caused multiple injuries and tragically one fatality, and in July, Air Europa Flight UX045 from Spain to Uruguay had to make an emergency landing in Brazil due to severe turbulence that led to the hospitalization of 30 people.
The Singapore Airlines Boeing 777-300 encountered clear-air turbulence (CAT), which is sudden severe turbulence occurring in cloudless regions that causes violent buffeting of aircraft. According to the US FAA, CAT is “especially troublesome because it is often encountered unexpectedly and frequently without visual clues to warn pilots of the hazard”.
Studies undertaken by the University of Reading have shown that climate change is worsening CAT. According to Paul Williams, professor of atmospheric science at the university’s Department of Meteorology, vertical windshear – one of the main causes of CAT – has already strengthened by 15% in the North Atlantic subpolar jet stream since 1979, increasing the amount of severe CAT by 55%. Some future predictions indicate that a doubling or trebling of severe turbulence will be reached within the next few decades across large parts of the middle latitudes, Williams notes, but whether increased turbulence in the atmosphere leads to increased turbulence on flights depends on several other factors.
“These include the design of the aircraft, as each generation responds better. For example, a 747 has relatively rigid wings compared with a 787. You could put these aircraft through the same turbulence and the 747 would be moving up and down a lot more than the 787 because the latter’s wings can absorb some of the turbulent energy, much like a car’s suspension smoothes out bumps in the road.
“Then there’s turbulence forecasting capabilities,” he continues. “They’ve increased from 60% detection 20 years ago to 70-75% today. If we continue getting better at forecasting CAT then pilots can avoid it, so increased turbulence in the atmosphere doesn’t necessarily mean bumpier flights,” he adds.
The challenge around forecasting CAT
CAT, often sudden and severe, can be the most hazardous of the three general types of turbulence at cruising altitudes (convective, mountain wave, CAT) because of the absence of visible clues to its existence. CAT was discovered in the 1940s when fighter pilots began to reach the high altitudes where it can occur, and work to improve its forecast has taken place ever since. The turbulence that affects aircraft is too small in scale to be resolved by routine numerical weather prediction (NWP) models; however, researchers have worked out that they can instead focus on the processes generating it, such as windshear, which are larger in scale.
“The biggest key is being able to properly model these weather patterns, which can be predicted accurately by location and altitude,” says DTN meteorologist Dan Lennartson. “Models have come a long way in recent years to enable good-quality forecasting of these locations and intensities,” he adds.
Advanced prediction algorithms
Williams’s team at the University of Reading has collaborated with US scientists to develop one of the most advanced CAT forecasting algorithms to date. This takes gridded data from NWP models and calculates a turbulence index to diagnose the subgrid turbulence, enabling the forecast of most of the turbulence up to 18 hours ahead.

This algorithm is being used in the USA in the official federal turbulence forecasting system, Graphical Turbulence Guidance (GTG). Developed at the National Center for Atmospheric Research (NCAR), GTG uses 10 indices to forecast turbulence in different ways, combining the results from them all to produce a final product. “There’s no one index that can capture 100% of turbulence, because of the different mechanisms that generate it. So, the state-of-the-art process is to create 10 different forecasts by measuring these different factors and put them all together,” says Williams.
Researchers continue to learn more about CAT generation mechanisms all the time. For example, we now know that atmospheric gravity waves can increase the shear and generate CAT, notes Williams, even in a region where the shear would otherwise have been too weak. “This effect is now factored in to our CAT forecasting algorithms. We’re now looking at the extent to which horizontal shear generates CAT, as well as inertial stability,” he explains.
Experts around the world continue to look at new ways to improve turbulence forecasting. For example, at Tohoku University in Japan, a supercomputer is being tested to improve the resolution of the numerical model and, in turn, the accuracy of turbulence prediction.
“We are studying aviation turbulence by using fine resolution numerical simulation on Japan’s most powerful supercomputer, Fugaku.”
Junshi Ito, Atmospheric Science Laboratory, Tohoku University
“We are studying aviation turbulence by using fine resolution numerical simulation on Japan’s most powerful supercomputer, Fugaku,” says Junshi Ito, associate professor at the university’s Atmospheric Science Laboratory. “It’s early days however, as R&D is still needed, computational infrastructures have to be upgraded and numerical simulations need to be evaluated.”
What does the future hold?
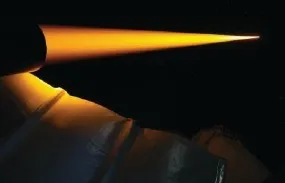
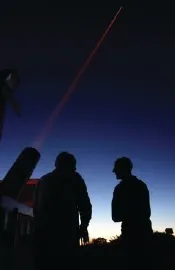
Another technology that could be a game-changer in terms of turbulence prediction is lidar, which can “observe the scattering of laser rays by aerosols in real time”, notes Ito. Onboard ultraviolet lidar has been demonstrated in test flights to be able to detect CAT up to 30km ahead of the aircraft in real time, but there are several issues currently stopping its rollout.
Firstly, the cost. An airline would spend more money retrofitting its existing fleet with lidar than it would save via avoided turbulence encounters. However, Williams notes that the business case might become more attractive as turbulence increases because of climate change.
A second challenge is the size of lidar systems. “It’s a heavy box that you’d need to put in the nose cone, and there isn’t enough room for it currently, in addition to the fact you wouldn’t want to add that extra weight,” Williams points out.
Then there are lidar’s current limitations. When piloting an aircraft, 30km doesn’t convert into a long time to react, Williams notes. “It’s long enough to put the seatbelt sign on and get everyone sat down, but maybe not to call up air traffic control and request a slight deviation.”
Finally, there are potential health and safety concerns arising from shining an ultraviolet laser out of an aircraft. “Can we absolutely guarantee that the laser beam wouldn’t accidentally enter the flight deck or cabin of another aircraft? These safety considerations will require careful thought. But it’s got a lot of potential – there would be no excuse for encountering CAT if you had this technology on board,” Williams concludes. “We’re now just waiting for the lidar geniuses to miniaturize the technology and bring the costs down. That would really revolutionize flying.”
Twinkle, twinkle, little star
Clear-air turbulence doesn’t just affect air travel – it also has an effect on satellite communication. This is a big area of interest currently, as researchers are working on solutions to provide free-space optical communication as a means of resilient and ubiquitous global comms. So much so that experts predict we will have multiple laser ground stations around the world to support such a network by 2040.
“You know when you look at the night sky and the stars appear to twinkle? That’s caused by CAT.”
James Osborn, Centre for Advanced Instrumentation, University of Durham
CAT is causing an issue with progression in this area, however, as when light travels through turbulence it is distorted, which means data is lost or corrupted. “You know when you look at the night sky and the stars appear to twinkle? That’s caused by CAT,” explains James Osborn, associate professor at the Centre for Advanced Instrumentation at the UK’s University of Durham.
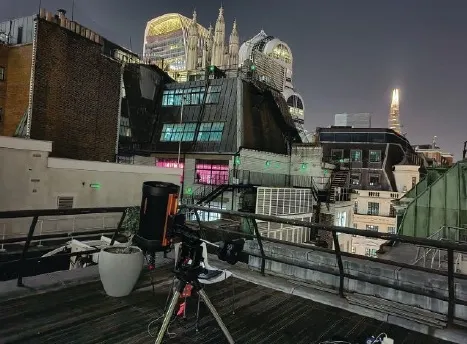
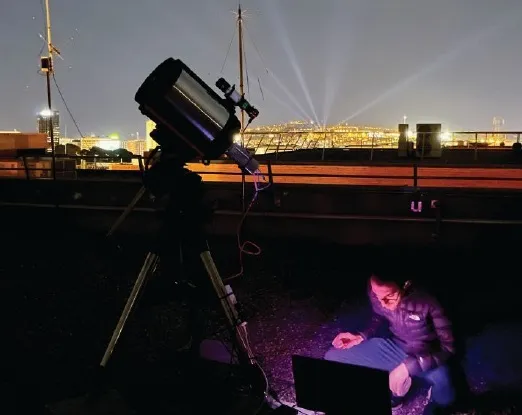
Osborn is part of the team at Durham that invented the Shack-Hartmann Image Motion Monitor (SHIMM) – a six-by-six array of lenses that measures atmospheric optical turbulence. “We can look at the magnitude of the refractive index variations that drive CAT, and we do that in the infrared, which enables us to essentially measure the ‘twinkliness of stars’ 24 hours a day,” he says.
The SHIMM is currently being tested in Barcelona, and Osborn hopes to replicate this at more sites to get further data for analysis. This is because alongside the SHIMM, Osborn’s team has developed a forecast tool for optical turbulence, which has been built on meteorological parameters such as wind speed, pressure and temperature to calculate the buoyancy and windshear at each altitude. “From that, we can estimate the magnitude of the optical turbulence,” he adds. “The problem has been, that until now, the only validation for this model has come from astronomical sites. If we’re able to roll out these instruments to more places globally we can validate and actually assimilate data into that forecast.
“So that’s where we’re at right now, the validation and assimilation stage, but ultimately what we want to do is be able to correct for the CAT,” Osborn continues. “That’s the next step: to use adaptive optics technology to correct for the distortions caused by the turbulence. This will enable the stars to consistently shine rather than sparkle, or in the case of free-space optical communication, ensure optical data transfer is more reliable,” he concludes.
This article originally appeared in the September 2024 issue of Meteorological Technology International. To view the magazine in full, click here.