Following the devastating impacts of hurricanes Milton and Helene, Meteorological Technology International finds out more about the key methods and technologies used to issue early warnings to help keep people and infrastructure safe.
In late September 2024 the US National Hurricane Centre (NHC) spotted a broad area of low pressure in the western Caribbean Sea. Over the next several days, due to a series of what NHC warning coordination meteorologist Robbie Berg calls “complex interactions”, this weather system expanded into a tropical storm. By early October, the NHC had designated it a hurricane, naming it Milton. “Early and late in the hurricane season we get this very broad circulation called the Central American gyre start forming over Central America,” says Berg. He explains that the gyre, a large weather system containing a lot of heavy rainfall, “kind of drifted north into the Gulf of Mexico, where there was already an old cold front that had stalled over the Gulf. The systems kind of combined to form Milton.”
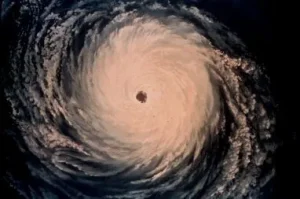
After intensifying rapidly, Hurricane Milton made landfall in Florida as the strongest tropical cyclone worldwide in 2024 (at the time of writing), killing 35 people and leading to US$85bn-worth of damage, according to preliminary estimates.
As part of his role at the NHC, the division of the US National Oceanic and Atmospheric Administration (NOAA) responsible for tracking and predicting tropical storms, Berg was responsible for sharing early warning information about Milton. This was done in two ways, he explains. The first was through the NHC forecasts about the storm, which were produced several days before it made landfall. They were made public immediately via “text and graphical products”, which were also disseminated to the media. “So, people who watch their local TV stations and national TV, they’re seeing our forecasts on the screen,” says Berg. “In a big-picture sense, that communication is already starting to get going.”
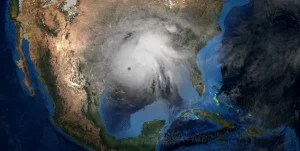
Once it was clear that the storm was likely to hit the US mainland, Berg and his colleagues began liaising with emergency managers for the various levels of regional and national government. “We do what’s called Decision Support Services, which is helping them [the emergency managers] make decisions before the storm, the biggest being about evacuations,” explains Berg.
Probabilistic forecasting
Besides the hurricane forecasting overseen by the Miami-based NHC, NOAA has several other early warning systems for extreme weather, notes Dave Bieger, branch chief at the US National Weather Service (NWS), also a division of NOAA. These include the probabilistic winter storm severity index (WSSI-P), a tool launched last year. “It provides a seven-day look at the probability of a winter storm having minor, moderate, major or extreme impacts to areas in the contiguous United States,” explains Bieger. “If there are high probabilities of a major or extreme winter storm event occurring, this can act as an early warning system to alert decision-makers and the public to pay attention to the potentially developing situation,” he adds.
For extreme heat, NWS uses a tool called HeatRisk, which provides a seven-day look at the chance for extreme heat occurrence with minor, moderate, major or extreme impacts.
There are similar systems for forecasting fire danger, tornadoes, large hail, high winds and excessive rainfall that could lead to flash floods. Once these weather hazards have been identified, NWS communicates the risk to the public via a system of weather advisories that generally divide the weather event into either a ‘watch’ or a ‘warning’ depending on its likely severity.
The job of communicating early warnings has been complicated by the rise of disinformation, notes Berg: “It becomes tougher for our message to get out there with all the noise that’s within the social media sphere.” He gives the example of Tropical Storm Nadine, a short-lived cyclone that made landfall in Belize in October 2024. According to Berg, the storm was being discussed on social media well in advance of it ever forming. “There were areas of disturbance we were tracking across the Atlantic but there was no new tropical storm yet,” he says. “Yet this information was being created in the social media world. It becomes very hard for people to know whether it’s coming from an official, trusted source, or it’s just somebody sitting behind a computer somewhere making this stuff up.”
Tropical cyclone tracking
NHC is not the only center tracking tropical cyclones; there are similar centers in India, Australia and Japan. According to Berg, NHC has oversight for the North Atlantic region and the eastern part of the Pacific. Weather systems occurring within those geographical locations that meet two important criteria are designated tropical cyclones.
“One is that it must have a circulation where the winds are circulating around what we call a ‘well-defined center’,” explains Berg. “The system also has to have what we call ‘organized deep convection’. So it can’t just be a general area of low pressure. It also has to have thunderstorm and shower activity in an organized sense within that circulation,” he adds.
The cyclone is upgraded to a tropical storm or hurricane “once the maximum winds reach at least 34kts or 39mph [63km/h]”. This is also the time when the storm is named. The naming convention for tropical storms is overseen by the WMO, which maintains a list of names that last for six hurricane seasons, with the list simply repeating after six years.
In the case of hurricanes that cause high levels of damage and loss of life, the name is usually retired following a vote from all the member nations within that region, notes Berg. As the North Atlantic region covers nations speaking several different languages, including Spanish French and Dutch, as well as English, “We try to maintain an assortment of names that use the languages of the region.” Because most of these storms form far out to sea, there is very little ground-based observation of the hurricanes. Most of the forecasting relies on satellite-based observations, notes Berg. The most widely used system for identifying tropical cyclone intensity is the Dvorak technique, a methodology developed in the late 1960s that uses visible and infrared satellite images.
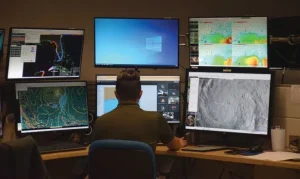
“It’s not exact but it’s the best tool we have to understand how strong the storm may be getting,” says Berg. “Then once the storm gets closer to land, that’s when we send aircraft to make more precise measurements of the wind inside the storm itself, and that essentially helps us fine-tune how strong it may be and what the structure is.”
“Once the storm gets closer to land, we send aircraft to make more precise measurements of the wind inside the storm itself”
Robbie Berg, National Hurricane Center
Rapid intensification
In recent years the job of estimating storm strength has been complicated by ‘rapid intensification’, a process by which storms grow exponentially in intensity within a short space of time. This happened in the case of Milton, which jumped in a matter of hours to a Category 5 hurricane with winds of 180mph (290km/h).
“We’ve had many cases of rapidly intensifying storms over the past 10 to 20 years, and that often reduces the amount of time people have to get ready and prepare,” says Berg. “Rapid intensification has been one of those aspects that’s been pretty difficult to forecast. We’ve been starting to see some improvements. We’ve had successes but there are still storms where it happens, and we don’t see it at all.”
It remains an area of debate among meteorologists as to whether the higher instances of rapid intensification are being caused by climate change. Roxy Mathew Koll, a climate scientist at the Indian Institute of Tropical Meteorology in Pune, thinks it’s highly likely. “Cyclones draw their energy – both heat and moisture – from warm ocean waters, which absorb over 90% of the excess heat from global warming,” he explains. “This added heat and moisture can fuel cyclones, allowing them to intensify rapidly, sometimes jumping from Category 1 to Category 3 or even 5 in a short span.”

Ocean-based observations
According to both Berg and Koll, accurate prediction of storm intensification would be helped by an improvement in the availability of ocean-based observations. Koll explains, “The heat driving cyclone formation isn’t just sourced from the ocean’s surface but also from the layers below. While surface temperatures are closely monitored by satellites, subsurface temperatures remain beyond their reach. Subsurface data is often collected by buoys and moorings, yet coverage across all ocean basins is still limited.
“Effective forecasting requires more than just monitoring these temperatures; we also need cyclone models to incorporate ocean subsurface dynamics, as well as buoy data to represent these dynamics. If any one of these components is missing, prediction accuracy is compromised.”
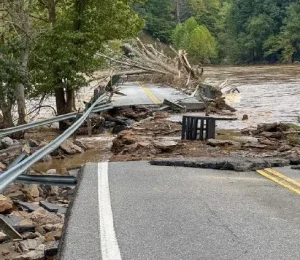
Another variable that remains hard to predict is the potential for loss of life, according to Berg. “There’s a whole host of reasons why particular storms end up creating more loss of life,” he says. “If you look at Hurricane Helene this year, the biggest loss of life occurred up in the mountains of the Carolinas, an area where they don’t typically see direct impacts from these tropical storms. You have several factors at play, whether it be the population that’s being affected or their experience level with storms of this magnitude. There’s a whole bunch of social reasons why somebody’s life might be lost in a hurricane beyond just the forecast itself.”
The countdown to a hurricane
Over the years, the US forecasting services have developed a sophisticated early warning system for hurricanes. Dave Bieger at the US National Weather Service (NWS) talks us through the timeline for early warning, from first detection to notifying the public.
Two to three weeks out, “The US Climate Prediction Center looks for signs in the guidance of possible tropical cyclone development,” he explains. According to Bieger, this information then goes into the Global Tropics Hazard Outlook, a probabilistic forecast for areas with elevated probabilities for cyclones.
Within a week of landfall, he notes, the National Hurricane Center (NHC) looks for signs in the guidance and in current observations “that indicate tropical cyclone development is possible”. This information goes into the NHC’s public-facing hurricane forecast, called the Tropical Weather Outlook, with probabilities of development provided for the seven-day graphical tropical weather forecast and the two-day forecast.
Tropical cyclone advisory products are issued either once a tropical cyclone forms or “once there is high enough confidence that the storm will develop and land-based watches and warnings will be necessary for the storm,” notes Bieger. Tropical storm, hurricane and storm surge watches are issued within 48 hours of the arrival of tropical storm-force winds. This is also the threshold for preparations for the storm to be completed, since after this time conditions become unsafe. Warnings for the hurricane are issued within 36 hours of the arrival of tropical storm-force winds. “To coincide with the issuing of warnings, wireless emergency alerts are sent to mobile devices,” Bieger adds.
Are hurricanes being affected by climate change?
Although the link between extreme weather and climate change is now broadly accepted, exactly how rising global temperatures lead to more frequent extreme weather events remains something of a mystery.
A case in point is Cyclone Freddy, a tropical cyclone that wreaked havoc in Madagascar, Mozambique and Malawi in March 2023. Freddy was the first tropical cyclone to experience seven phases of rapid intensification as it moved in a unique back-and-forth pattern between the coasts of Madagascar and Mozambique over a 22-day period. The cyclone also broke the record for accumulated cyclone energy (ACE) – the total wind energy generated by a tropical cyclone throughout its lifetime.
“Freddy broke several records; it’s not clear how much climate change has fueled this,” says Roxy Mathew Koll at the Indian Institute of Tropical Meteorology. “But surely the warm waters played a role in it consistently sourcing heat and moisture throughout its lifetime.
“Freddy broke several records; it’s not clear how much climate change has fueled this”
Roxy Mathew Koll, Indian Institute of Tropical Meteorology
“The cyclone track was almost entirely over the ocean, and this is a factor that kept the cyclone alive. Over land, their source of energy supply – heat and moisture from the warm ocean – is cut off. Also, friction over the land reduces cyclone intensity,” he adds.
The multiple instances of rapid intensification and the movement of Freddy back and forth between the coasts took weather agencies by surprise. Koll says he checked the ocean temperatures between Mozambique and Madagascar during the second loop that Freddy took between them. “Both the surface and subsurface waters were quite warm to keep the cyclone alive, and also provided a lot of moisture – we saw the cyclone dumping a lot of rains over land,” he reports.
According to Koll, the persistently warm ocean waters and excess supply of moisture that fueled Freddy’s abnormally long duration are “a clear signal of climate change”.
This article originally appeared in the January 2025 issue of Meteorological Technology International. To view the magazine in full, click here.


