According to the WMO, air pollution is the world’s leading environmental cause of illness and early death, responsible for seven million premature deaths a year. To reduce this figure, better understanding of the causes and movements of air pollution is needed to help develop improved forecasts and health warnings for vulnerable people, as well as to aid policymakers and leaders in taking the right steps to reduce pollutants.
Larger amounts of more detailed, hyperlocal data on air quality are therefore needed, especially in urban areas, which are particularly challenging for air quality forecasts because they are densely populated and contain many different pollution sources. Marko Torvinen, head of forecasting at Vaisala, says, “In these environments air quality can vary considerably within tens of meters and pollutant concentrations can accumulate suddenly and unexpectedly.”
Coastal urban areas are particularly challenging to model, as the water interface can lead to some very complex and/or small-scale weather patterns. “Take somewhere like New York,” says Laura Judd, a research physical scientist at NASA’s Langley Research Center. “If the city’s air pollution is blown out over Long Island Sound, for example, it will be stuck near the surface and cook secondary pollutants that are chemically produced, such as particulate matter and ozone. Then you get the sea breezes, which bring it back over land.
“Often beaches and coastal environments have the poorest air quality, but it’s very shallow vertically, which is a challenge for satellites because they measure the amount of air pollution between the surface and top of the atmosphere, not what we’re exposed to at nose level.”
Introducing TEMPO
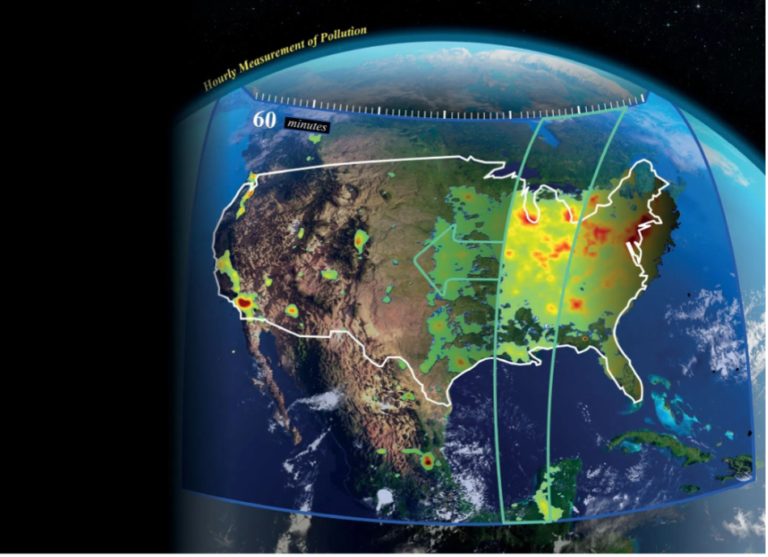
Today’s air quality forecasts are around 12km resolution, but according to Judd, you don’t really resolve what’s going on until you get into much finer detail. There has therefore been a lot of work to push the boundaries of what’s possible and improve on the standard resolution the meteorological sector is currently familiar with. One of the results of this work is NASA’s TEMPO – Tropospheric Emissions: Monitoring of Pollution, which measures at a spatial resolution not seen before – on average 2.5km by 5km.
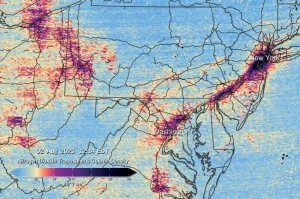
This is also the first space-based instrument designed to continuously measure air quality across North America. Launched in April 2023 on a Maxar Intelsat 40e geostationary satellite, it became fully operational in October 2023 and during the day makes hourly scans of the lower atmosphere from the east to west coasts and from Mexico City to central Canada.
It forms part of a constellation of air pollution monitors for the northern hemisphere, which includes South Korea’s Geostationary Environment Spectrometer and the European Space Agency’s (ESA) Sentinel-4 satellite. TEMPO’s main instrument is an advanced spectrometer that detects pollution normally hidden within reflected sunlight, and it can measure concentrations of everything from ozone, nitrogen dioxide and sulfur dioxide through to aerosols, water vapor and several trace gases down to an accuracy of parts per billion.
“TEMPO’s instrumentation measures ultraviolet and visible light that has traveled through the atmosphere and back up to the instrument,” explains Judd. These pollutants have been measured, albeit in less detail, by existing instruments for roughly 20 years, but TEMPO provides a new perspective scientists haven’t had before.
A new perspective
Whereas the older satellites have been in low earth orbit, TEMPO is approximately 36,000km above the equator and is geostationary, enabling researchers to gather measurements of the same area at different times of the day and see how different periods of time, such as rush hour, affect air quality.

“We do have models that try to simulate that, but we haven’t had this top-down perspective before to evaluate if we are doing it right,” says Judd. “The only data sets we had were from monitors on the surface – and we couldn’t monitor everywhere. One of the challenges of the models is getting the right vertical distribution of the pollutants through the atmosphere, so having that whole column from TEMPO is very valuable.”
One of the things unique to TEMPO is that it measures further out to the red wavelengths. It can combine ultraviolet and longer visible wavelengths, and the team is going to attempt to separate the lower atmospheric ozone amounts from the tropospheric and stratospheric column.
“That’s not going to be an easy feat, but it will be really exciting if we can get this product validated and see if we can use it to understand the distribution of surface ozone,” says Judd. “There’s a lot going on in the different layers. Research has shown that we have to understand the different times of day and regionally and spatially how that relates to surface air pollution.”
Time to validate
Over the summer, NASA, NOAA and partners at 21 universities undertook their most ambitious and sophisticated air pollution research campaign to date – AGES+. Their aim was to understand regional urban air quality issues and how air pollution sources have shifted over recent decades from fossil fuel emissions to volatile chemical products – consumer products derived from fossil fuels – and even wildfires.
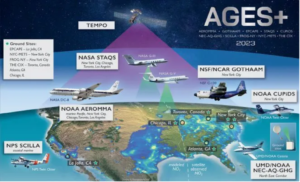
Several coordinated research campaigns took place in June, July and August using multiple satellites, seven research aircraft, numerous vehicles, dozens of stationary installations and even instrument backpacks. The largest of the projects was AEROMMA, in which 30 specialist instruments were put onto NASA’s Gulfstream DC-8 flying laboratory, which collected chemical measurements from Los Angeles, Chicago, New York City and Toronto.
“This project had three goals,” says Rebecca Schwantes, a research chemist at NOAA’s Chemical Sciences Laboratory (CSL). “First, to better understand the marine boundary layer, particularly the sulfur cycle and how that affects climate; second, to improve knowledge of urban emissions and how pollutants are formed in the urban boundary layer; third, to validate TEMPO.”
This will be achieved by comparing the measurements from all the summer’s projects with those of TEMPO’s high-resolution estimates of trace gas and aerosols, as well as with emission inventories and atmospheric processes. To accelerate TEMPO’s work further, another mission – Synergistic TEMPO Air Quality Science, or STAQS – took ground and airborne measurements to help evaluate TEMPO level 2 data products, such as NO2 measurements, geophysically, spatially and temporally; interpret the temporal and spatial evolution of air quality events tracked by TEMPO; and assess the benefit of assimilating TEMPO data into chemical transportation models.
Advancing research
Lessons learned from all these projects will aid the interpretation of TEMPO data, which in turn will improve our understanding of urban air quality and advance research. “The data has so many uses,” says Schwantes. “It will help us investigate why cities are plateauing in terms of air pollution reduction and how electrification of vehicles might benefit air quality. We can better understand what the other sources of air pollution are, which is something we’ve mostly ignored in the past because vehicle emissions were so dominant, but it will be important in the future. “With this information we can inform policymakers on how they could target different regulations, but we also want to use the data to improve our operational models.
“We sampled a lot of wildfire smoke impacting the urban environment,” Schwantes continues, “which is really interesting for operational air quality forecasting because there’s a big initiative to understand how wildfires affect people’s health and we need to make sure our operational systems represent that accurately.”
Other projects and solutions
It’s important to note that TEMPO isn’t alone in its work to advance hyperlocal air quality. Academic research is underway at universities around the world, including Complutense University in Madrid (see How Planetwatch’s data can improve air quality monitoring, below), and a pilot study called Air Inequality in New York was a part of this summer’s coordinated research campaign in the US.
This entailed researchers walking and biking around the city wearing an instrument-laden backpack to gather data at a truly hyperlocal scale. “We’re talking a scale of hundreds of meters,” says Schwantes. “At the same time as they traveled around, we were flying above them. We hope that with this data we can bridge the gap and understand what information we’re missing.”
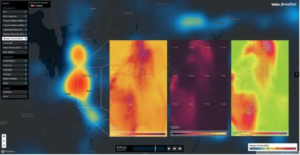
Much of the research into hyperlocal air quality forecasts is being done by the private sector, and solutions such as BreezoMeter, recently acquired by Google, and Vaisala’s Xweather are already available. “Our enhanced hyperlocal air quality forecasting has a 13m resolution and provides a nowcast with one-hour updates and a long-term forecast up to 4.5 days ahead,” says Laura Alku, air quality product manager at Vaisala. “You can monitor the air quality index, the level of pollutants and the impact of forest fires on your city.”
The future of hyperlocal air quality monitoring
There’s still much work to be done to improve hyperlocal air quality monitoring and Judd notes that there will always be a desire for higherresolution data. However, that comes with its own challenges. “That’s much more data to deal with and interpret, especially in a city, where air quality is dynamic and variable,” she says.
Vladimir Kuzmanovski, data scientist at Vaisala, believes that striving for ever higher resolution may not bring much extra value because, “We’re already at a point where the resolution is good enough for all practical needs.” Instead, he believes the focus should be on improving the quality of the data. “Reliable and precise forecasts require access to high-quality data from various sources – better sensor observations, satellite images, geographical data and dynamic emission data.
“We also need to improve the observation network by analyzing the existing air quality sensor network and recommending optimal locations for new sensors. In practice, this will allow the conversion of data into information that can be used in near real time, in a personalized manner, and offer insights for proactive air quality management and policies.”
HOW PLANETWATCH’S DATA CAN IMPROVE AIR QUALITY MONITORING The Transport, Infrastructure and Territory Research Group (tGIS) at the Complutense University of Madrid has increasingly become drawn to the use of big data in the fields of mobility, transportation and urban dynamics. In June 2023, during his work on local-scale spatial analysis of urban air pollution concentrations, group member Richard Hewitt came across PlanetWatch, which uses blockchain, advanced algorithms and sensors to deploy hyperlocal air quality monitoring networks to empower organizations with accurate data to fight air pollution. He was looking at how to use existing air pollution data from regional monitoring stations for air quality models. “The main importance of data provided by PlanetWatch is that it potentially enables the problem of interpolation based on very few points to be solved by providing sensor data at a higher spatial resolution and higher temporal resolution than existing public monitoring stations,” he explains. “Potentially this means that much more accurate forecasting becomes possible.”
PlanetWatch sensors record humidity, particle matter at 10μm and 2.5μm or less in diameter, and temperature. “The coverage is complementary to existing stations and the network is denser,” notes Hewitt. “In this sense the PlanetWatch sensors clearly add value to existing public data sets for the monitoring of these variables.”
The group is now exploring how PlanetWatch’s data can improve on existing approaches to air quality monitoring. By reviewing data on London, Munich, Madrid and Budapest, it aims to develop better-quality interpolations showing how air pollution varies over time and space, and compare PlanetWatch data with existing outputs from air quality simulation models.
“My personal interest relates to the use of air quality data to explore issues of social justice,” says Hewitt. “Lower-income and disadvantaged neighborhoods tend to be in more contaminated areas, but it’s very hard to demonstrate this at neighborhood level.
“The PlanetWatch data offers an opportunity to examine this. If statistically significant patterns do emerge, showing that marginalized communities are systematically more affected by air pollution, it becomes easier to persuade city authorities to enact measures to improve the situation. Without this evidence it’s harder to enact policy, and without good-quality data we cannot collect the evidence,” he concludes.
A longer version of this article originally appeared in the January 2023 issue of Meteorological Technology International. To view the magazine in full, click here.