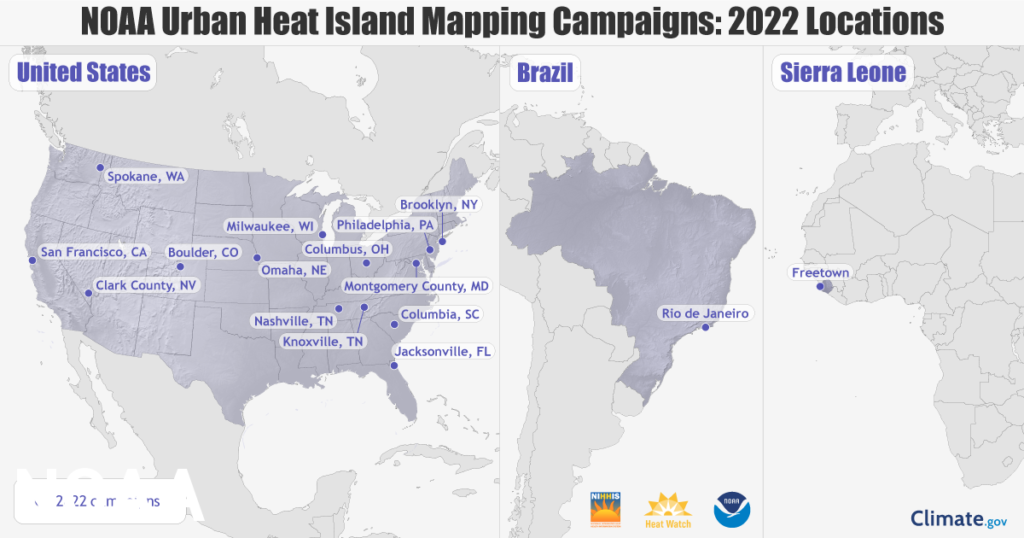
NOAA’s Climate Program Office is working with the government-backed National Integrated Heat Health Information System (NIHHIS) and data analytics firm CAPA Strategies to map the hottest parts of 14 US cities and counties.
The new community-led heat mapping campaign will monitor urban heat islands – areas that can be up to 20ºF hotter than nearby neighborhoods.
Don Graves, US deputy secretary of commerce, said, “Extreme heat kills more Americans than any other weather event and has the greatest impact on our nation’s most vulnerable communities. Fortunately, our talented and dedicated researchers and scientists at NOAA are working directly with communities across the country to help them take action to manage extreme heat. As climate change worsens heat waves, this critical information will help bring local and equitable solutions for those facing the greatest threats.”
Rick Spinrad, NOAA administrator, said, “Our nation faces a climate crisis that has exacerbated inequities for low-income communities and communities of color. NOAA is helping communities measure their hottest places so that they can use this information to inform strategies to reduce the unhealthy and deadly effects of extreme heat and help us build a climate ready nation.”
The US communities chosen for the program include Boulder, Colorado; Clark County, Nevada, which includes Las Vegas; Columbia, South Carolina; Columbus, Ohio; Jacksonville, Florida; Knoxville and Nashville, Tennessee; Milwaukee, Wisconsin; Montgomery County, Maryland; Omaha, Nebraska; Spokane, Washington; Philadelphia; Brooklyn, New York and San Francisco. In addition, NOAA is working with local groups in Africa and Brazil on international campaigns in Freetown, Sierra Leone, and Rio de Janeiro, Brazil.
Over the past five years, NOAA has funded CAPA Strategies to provide science support for 35 community-led campaigns to map urban heat islands. Using heat sensors mounted on cars or bikes, volunteer citizen scientists, led by a team of local partners in each city, will traverse their neighborhoods in the morning, afternoon and evening on one of the hottest days of the year. The sensors record temperature, humidity, time and the volunteers’ location every second.
CAPA’s end-to-end program, including sensor technology, analysis and modeling, and community engagement, allows communities to develop hyper-local descriptions of heat and strategize mitigation options specific to each region of the country. During the 2021 urban heat island campaign, 799 citizen scientists took 1.2 million measurements in 24 communities.
The 2022 heat mapping campaign will also feature new, NOAA-funded instruments to better characterize urban climate and health hazards. Columbus, Ohio, and Philadelphia will use mobile air quality monitors to develop an understanding of the related impacts of heat and air quality. Clark County, Nevada, and Columbia, South Carolina, will install stationary temperature and humidity sensors to provide more information for decision-making through monitoring the urban heat island effect over the length of the summer.
Cities from past campaigns have used their heat island maps to develop heat action plans, add cooling stations to bus shelters, educate residents and policymakers and inform new research. Last year, NIHHIS funded five new applied research projects in cities across the country to help develop tools for equitable heat intervention, investigate heat in rural areas and smaller cities and investigate the effect of coastlines on urban heat patterns.


