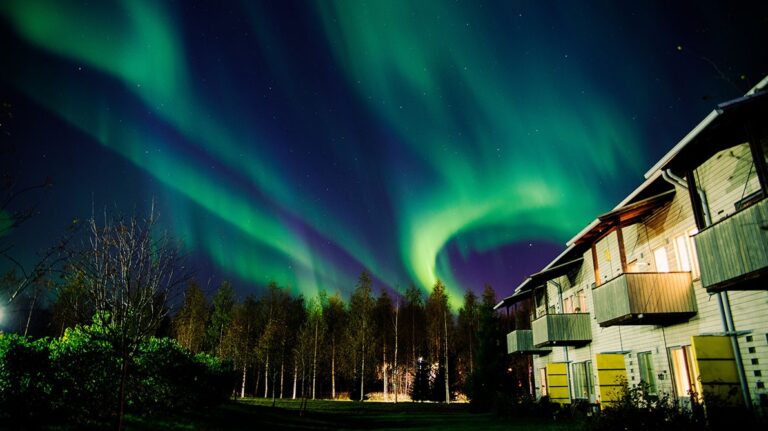
The Finnish Meteorological Institute (FMI) has updated its real-time products serving those who wish to see the aurora borealis, including the magnetic activity map and the bar chart showing the history of the day.
When the northern lights light up the sky, increased fluctuation is usually measured in the magnetic field on Earth’s surface. For about 20 years, the FMI has used this measure as the foundation of its real-time monitoring of magnetic activity to indicate the likelihood of the appearance of the aurora.
Some improvements have now been introduced to the aurora borealis service. The principle is unchanged – growing variations in the magnetic field reveal an increase in the likelihood of the appearance of the aurora. The most recent values that have been measured are displayed on a map and the daily history is shown in a bar chart for each observation station. The most important change is that the FMI has added a second threshold value and redefined the threshold values used for reporting a growing likelihood of the aurora.
To set the threshold values, the organization used 146,747 pictures from aurora borealis cameras in Kevo, Muonio and Hankasalmi. The images showed 463 hours of aurora displays as well as moments of dark sky, which was important for acquiring statistical material on the kinds of activity levels that usually do not involve the aurora.
The higher threshold value was largely equal in its significance to the previous one; when it is exceeded, an imposing aurora is likely to appear. This is why the columns and the markings on the map are colored red when the higher threshold is exceeded – previously this was done when the only threshold was crossed.
When the FMI’s newly introduced lower threshold is crossed, the columns and the markings on the map are colored yellow. When the lower level is exceeded but the higher one is not, the appearance of an aurora is quite possible, but it is usually dim and subdued. Each monitoring location still needs its own threshold values, which are presented in the form of horizontal lines in the bar chart.
The change also involved the way that the activity index is calculated. The organization calls it the R-index, where ‘R’ refers to revontuli – the Finnish word for the aurora borealis. The R-index describes the speed of change in the magnetic field, but it does not directly involve physical units. The value of the R-index is usually in the 10s or 100s, which means that it can be conveniently reported as an integer.
The R-index is calculated at intervals of five minutes instead of 10 minutes, as was done in the previous activity index. This means that the service is now closer to real time than it was before. The accessibility of the service has also been improved. The yellow markings on the map have been changed to squares and the red ones are shaped as rhombuses, which means that identifying the different levels no longer depends on color alone.
To find out more about the Finnish Meteorological Institute’s latest developments, click here


