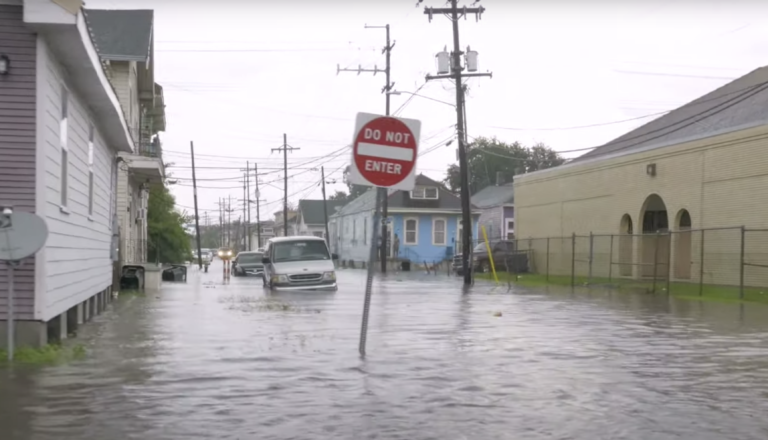
A new machine learning approach developed by researchers at Stanford University in California, is helping scientists understand why extreme precipitation days in the Midwestern United States are becoming more frequent.
The approach is one of the first examples using AI to analyze causes of long-term changes in extreme events and could help make projections of such events more accurate.
Among other impacts, global warming is expected to drive heavier rain and snowfall by creating a warmer atmosphere that can hold more moisture. Scientists hypothesize that climate change may affect precipitation in other ways, too, such as changing when and where storms occur. Revealing these impacts has remained difficult, however, in part because global climate models do not necessarily have the spatial resolution to model these regional extreme events.
“This new approach to leveraging machine learning techniques is opening new avenues in our understanding of the underlying causes of changing extremes,” said study co-author Noah Diffenbaugh, the Kara J Foundation professor in the School of Earth, Energy and Environmental Sciences. “That could enable communities and decision makers to better prepare for high-impact events, such as those that are so extreme that they fall outside of our historical experience.”
Diffenbaugh, along with study lead author Frances Davenport, a PhD student in Earth system science in Stanford’s School of Earth, Energy and Environment Sciences, focused on the upper Mississippi watershed and the eastern part of the Missouri watershed. The highly flood-prone region, which spans parts of nine states, has seen extreme precipitation days and major floods become more frequent in recent decades.
The researchers started by using publicly available climate data to calculate the number of extreme precipitation days in the region from 1981 to 2019. Then they trained a machine learning algorithm designed for analyzing grid data, such as images, to identify large-scale atmospheric circulation patterns associated with extreme precipitation (above the 95th percentile).
“The algorithm we use correctly identifies over 90% of the extreme precipitation days, which is higher than the performance of traditional statistical methods that we tested,” Davenport explained.
The trained machine learning algorithm revealed that multiple factors are responsible for the recent increase in Midwest extreme precipitation. During the 21st century, the atmospheric pressure patterns that lead to extreme Midwest precipitation have become more frequent, increasing at a rate of about one additional day per year, although the researchers note that the changes are much weaker going back further in time to the 1980s.
However, the researchers found that when these atmospheric pressure patterns do occur, the amount of precipitation that results has clearly increased. As a result, days with these conditions are more likely to have extreme precipitation now than they did in the past. Davenport and Diffenbaugh also found that increases in the precipitation intensity on these days were associated with higher atmospheric moisture flows from the Gulf of Mexico into the Midwest, bringing the water necessary for heavy rainfall in the region.
The researchers hope to extend their approach to look at how these different factors will affect extreme precipitation in the future. They also envision redeploying the tool to focus on other regions and types of extreme events, and to analyze distinct extreme precipitation causes, such as weather fronts or tropical cyclones. These applications will help further parse climate change’s connections to extreme weather.
Read the full paper here: Using Machine Learning to Analyze Physical Causes of Climate Change: A Case Study of US Midwest Extreme Precipitation.


